CFO Presentation Template: How to Justify Test Automation With ROI Data
Template presentation: 3 metrics that convince finance every time.
Your CFO Only Cares About Three Things
When you ask your CFO for $500K to invest in test automation, they do not think about quality. They think about three things:
How much money will I save? How fast will I get my money back? How risky is this investment?
If you cannot answer these three questions with data, your request gets rejected. Here is the template that works.
The 3-Metric CFO Presentation (Copy This Template)
METRIC #1: Annual Cost Savings
CFOs care about one number: How much less will we spend on QA?
Here is the template calculation (for a 50-person engineering org):
QA Activity | Current Cost | After Automation | Savings |
Manual regression testing | $480K | $60K | $420K |
Bug verification cycles | $240K | $80K | $160K |
Release delay costs | $300K | $100K | $200K |
Production bug fixes | $180K | $80K | $100K |
TOTAL ANNUAL SAVINGS | $1.2M | $320K | $880K |
Bottom line for your CFO: We will spend $880K less per year on QA.
METRIC #2: Payback Period
CFO question: How long until we break even?
Investment cost breakdown:
Investment Category | Cost (Year 1) |
Automation framework setup | $80K |
Test infrastructure (CI/CD, servers) | $120K |
Automation engineer (1 FTE) | $150K |
Training and tooling | $50K |
TOTAL YEAR 1 INVESTMENT | $400K |
Payback math: $400K investment / $880K annual savings = 5.5 months payback. After that, pure profit.
METRIC #3: 3-Year ROI
This is the number that closes the deal.
Period | Savings | Costs | Net Benefit |
Year 1 | $880K | $400K | $480K |
Year 2 | $880K | $150K | $730K |
Year 3 | $880K | $150K | $730K |
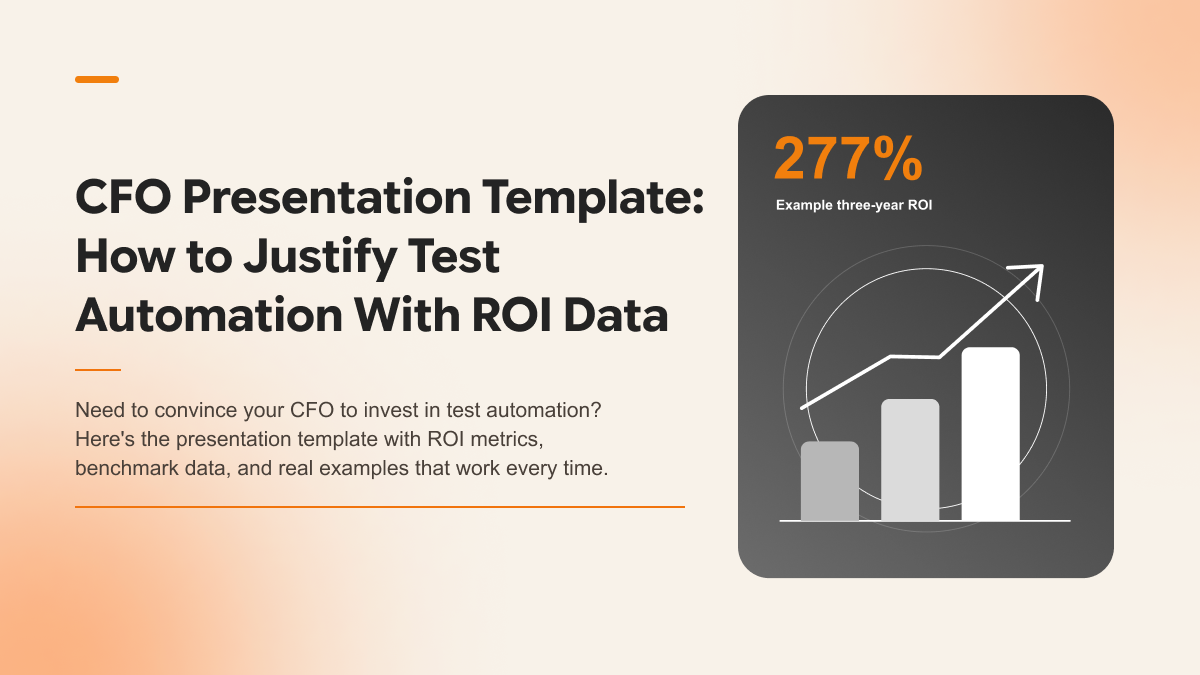
3-YEAR TOTAL | $2.64M | $700K | $1.94M (277% ROI) |
Bottom line: $1.94M profit over 3 years. 277% ROI.
What Other Companies Are Spending (Industry Benchmarks)
Your CFO will ask: What are other companies doing? Here are the benchmarks by industry:
Industry | Avg Automation Budget | Annual Savings | Payback Period |
Fintech | $450K | $1.2M | 4.5 months |
Insurance | $350K | $920K | 4.8 months |
Healthcare | $400K | $1.1M | 4.3 months |
SaaS | $380K | $950K | 4.8 months |
E-commerce | $420K | $1.05M | 4.8 months |
Key insight for your CFO: Every industry sees payback in 4-5 months. This is not risky. This is proven.
Real Examples (The Stories That Convince CFOs)
Example 1: Regional Bank (150-person engineering)
Investment: $600K. Annual savings: $1.8M. Payback: 4 months. 3-year ROI: $4.2M (700%). CFO quote: We recovered our investment in a quarter. This is one of the best investments we have made.
Example 2: Healthcare SaaS (75-person engineering)
Investment: $380K. Annual savings: $950K. Payback: 4.8 months. 3-year ROI: $2.1M (553%). CFO quote: The only question was why we were not doing this earlier.
Example 3: Fintech Startup (100-person engineering)
Investment: $450K. Annual savings: $1.2M. Payback: 4.5 months. 3-year ROI: $2.85M (633%). CFO quote: This investment lets us move faster without hiring more QA. That is worth far more than the money we save.
Risk Mitigation (What Happens If Results Are Slower?)
Your CFO will ask: What if payback takes longer?
Scenario 1 (Conservative): Payback extends to 9 months instead of 5.5 months. Year 1 net benefit: $200K instead of $480K. Still positive.
Scenario 2 (Pessimistic): Savings are 50% lower. Payback takes 11 months. 3-year ROI drops to 150% instead of 277%. Still extremely positive.
Scenario 3 (Worst Case): Everything fails. You lose $400K in year 1. This is still less than 1 month of your QA budget.
The risk is asymmetric: High upside, capped downside. This is exactly what CFOs want.
The Pitch (30-Second Version for Your CFO)
We are spending $1.2M per year on manual QA work that can be automated. For a $400K investment, we can reduce that to $320K, saving $880K annually. We break even in 5.5 months. Over 3 years, we profit $1.94M. Every other company in our industry is doing this.